I am finally done with my second semester towards my PhD, which means it’s time for sum-mer and some-more (or a-lot-more) research!
I happened to have two course projects that I only recently wrapped up, and they turned out to be somewhat related! The two topics being sparse principal component analysis (SPCA) and non-negative matrix factorization (NMF). Both of them, key tools to help interpret data better.
So wait. Given a set of data points, can’t we as humans do the intelligible task of interpretation? What do these data-interpretations tools do that we can’t?
The answer: they don’t do anything we can’t. They are just better at interpreting a larger scale of data. They’re like a self-organizing library. The librarian no longer has to assign books to particular sections, the books do that themselves (not that we want to put librarians out of business)!
Those familiar with machine learning will automatically recognize this problem formulation as that of unsupervised learning. Employ algorithms that make sense out of data! Principal component analysis, does just that. It tries to represent the variation in the data in descending order. The first principal direction has the maximum variation in data. Usually the first few principal components (usually, this number is 

Mathematically speaking, the PCA problem boils down to the singular value decomposition,
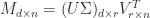
where our data matrix 

The non-negative matrix factorization problem is similar. A non-negative matrix can be decomposed into non-negative matrices 

The basic concept utilized in both of these methods is the same: most data has an underlying structure. Imposing the knowledge of this structure should help us extract meaningful information about this data.
Like what? For example in a text dataset, most articles focus on a few core topics. Further, these core topics, can be represented using few core words. This spurred several cool applications, such as detection of trends on social media. In image processing, this has useful applications in segmentation. Representing images as a sum or weighted sum of components. Demixing of audio signals. The list goes on and on and I bet you can already sense the theme in this one.

